Solar Inspect for automated solar panel inspection
Solar Inspect turns a processed drone survey into an interactive solar panel inspection. It detects photovoltaic panels automatically, aligns them between the RGB orthomosaic and the radiometric thermal map, and flags thermal anomalies that may indicate a faulty panel.
The result is a panel-by-panel inventory that you can inspect on both map layers, correct manually, download and include in a PDF report.
A thermal anomaly shows that a panel behaves differently from its surroundings. It does not by itself confirm the electrical cause of a fault. Review flagged panels and verify important findings on site.
Requirements
Solar Inspect is available on the Pro plan. The project must be finished and contain both:
- An RGB orthomosaic, used to detect panel geometry.
- A radiometric thermal map, used to measure surface temperatures and identify thermal anomalies.
A colourised thermal preview is not enough because it does not contain a real temperature value for every pixel. See image requirements.
Running Solar Inspect
Open the processed project in the viewer and select Modules. Start Solar Inspect separately from the original processing job. A run usually takes 1–3 minutes, depending on the size of the solar installation.
The module reports its progress while it detects panel outlines, matches the RGB and thermal data, samples panel temperatures and evaluates thermal signals. When the run finishes, the panel overlays and result summary become available inside the same Modules tab.
Review controls and panel states

The result toolbar lets you:
- Run analysis again after the source maps or saved panel corrections change.
- Hide all panels or hide only the faulty panel overlay.
- Draw new panel when automatic detection missed one.
- Browse faulty panels one by one and move the map to each result.
- Download all results as one module result bundle.
Panel outlines use separate states so the result can be scanned quickly:
- Normal. The panel was evaluated and no thermal anomaly was detected.
- Faulty. The module detected a thermal anomaly, or the user marked the panel as faulty during manual review.
- Alignment uncertain. The RGB and thermal position could not be matched with enough confidence. Check the panel manually before acting on the result.
- Not evaluated. No reliable thermal decision is available, or the panel was added or redrawn and has not yet been analysed again.
Manually reviewed or saved polygons use a dashed outline so they remain distinguishable from the untouched automatic result.
Panels on the RGB and thermal maps
Solar Inspect displays the detected polygons on the RGB orthomosaic and the thermal map. The same panel identity is kept across both layers, so you can compare visible condition with thermal behaviour.
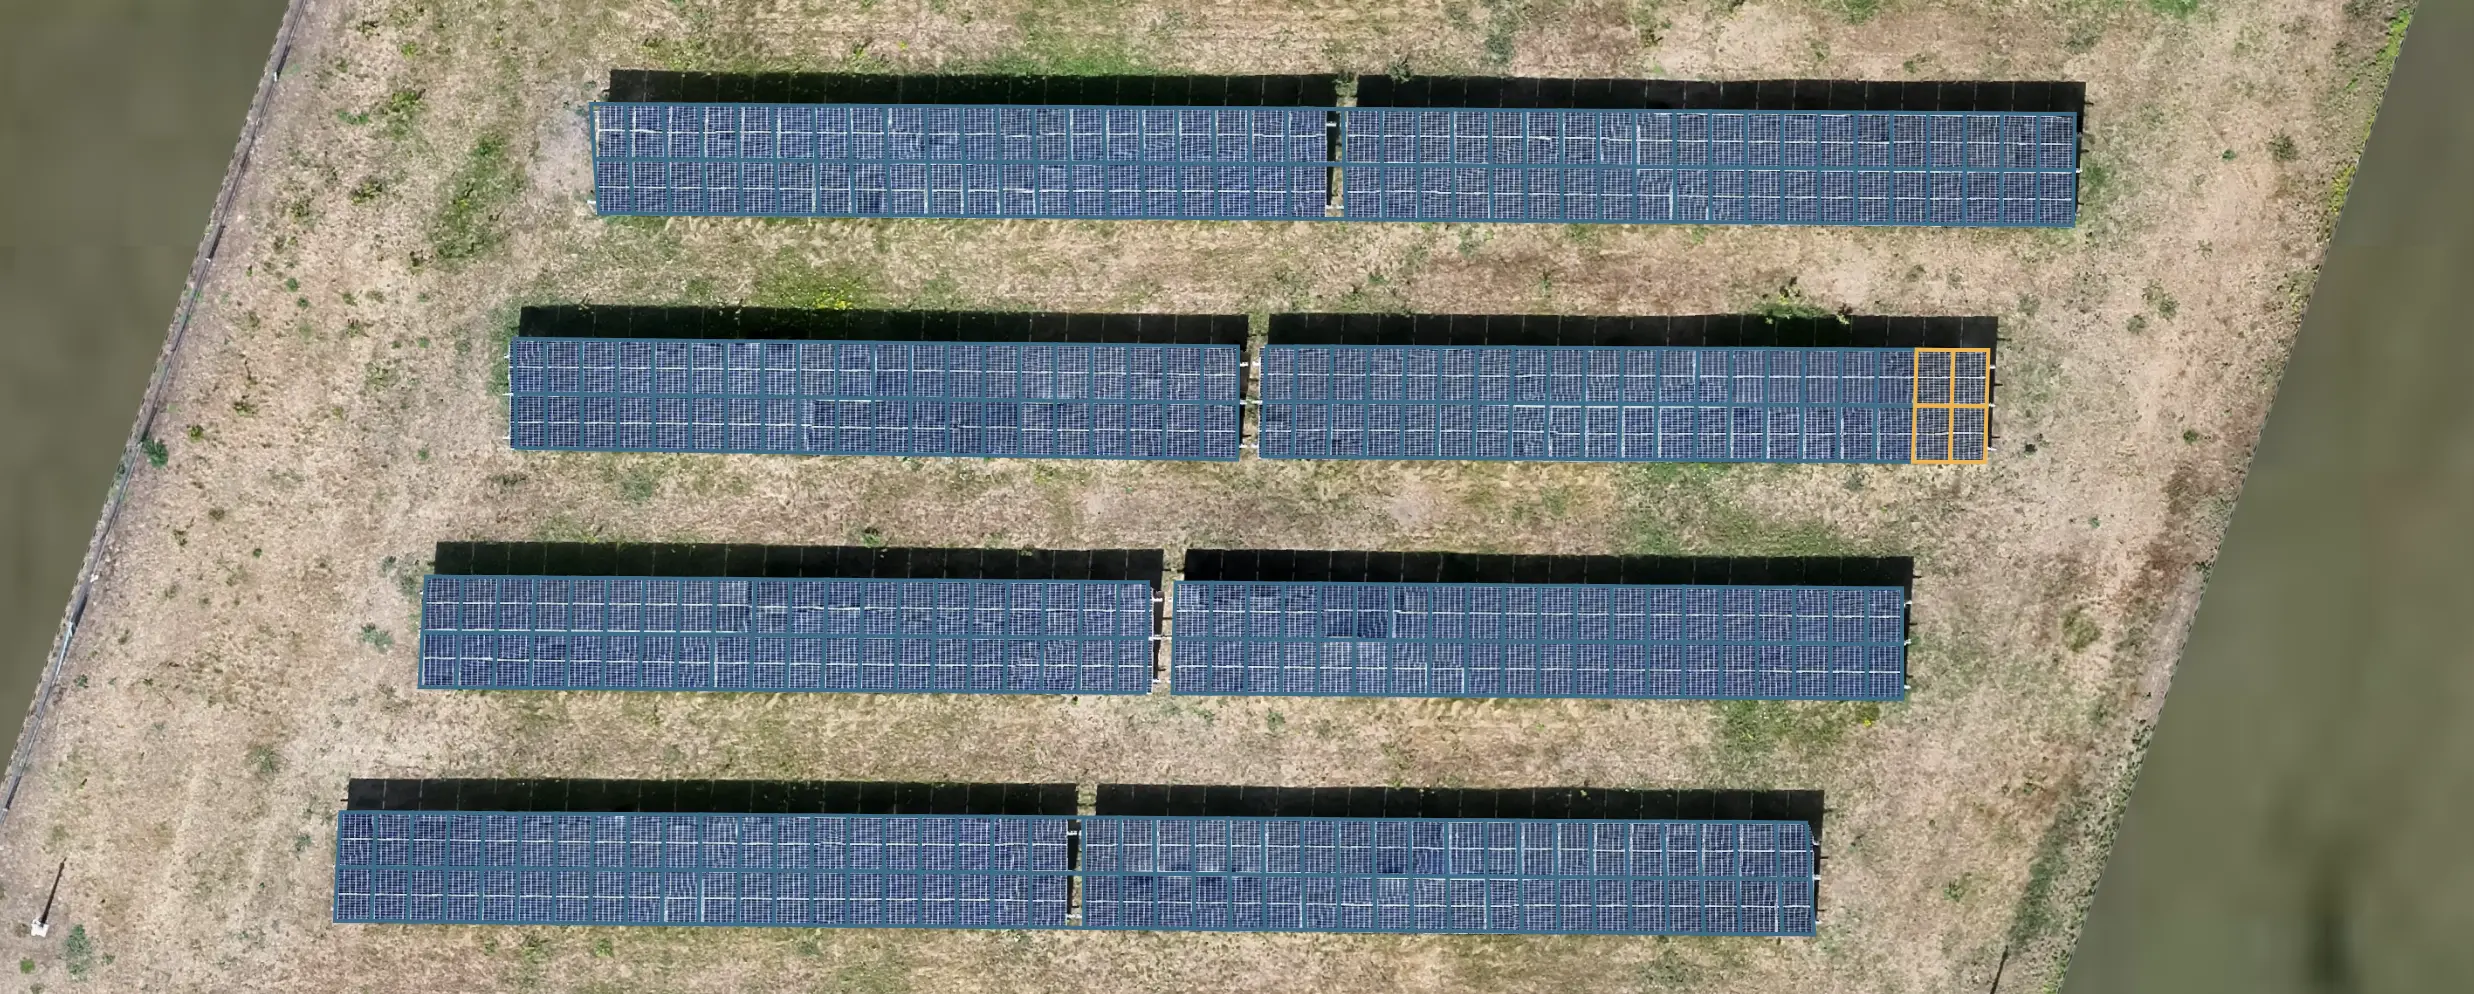
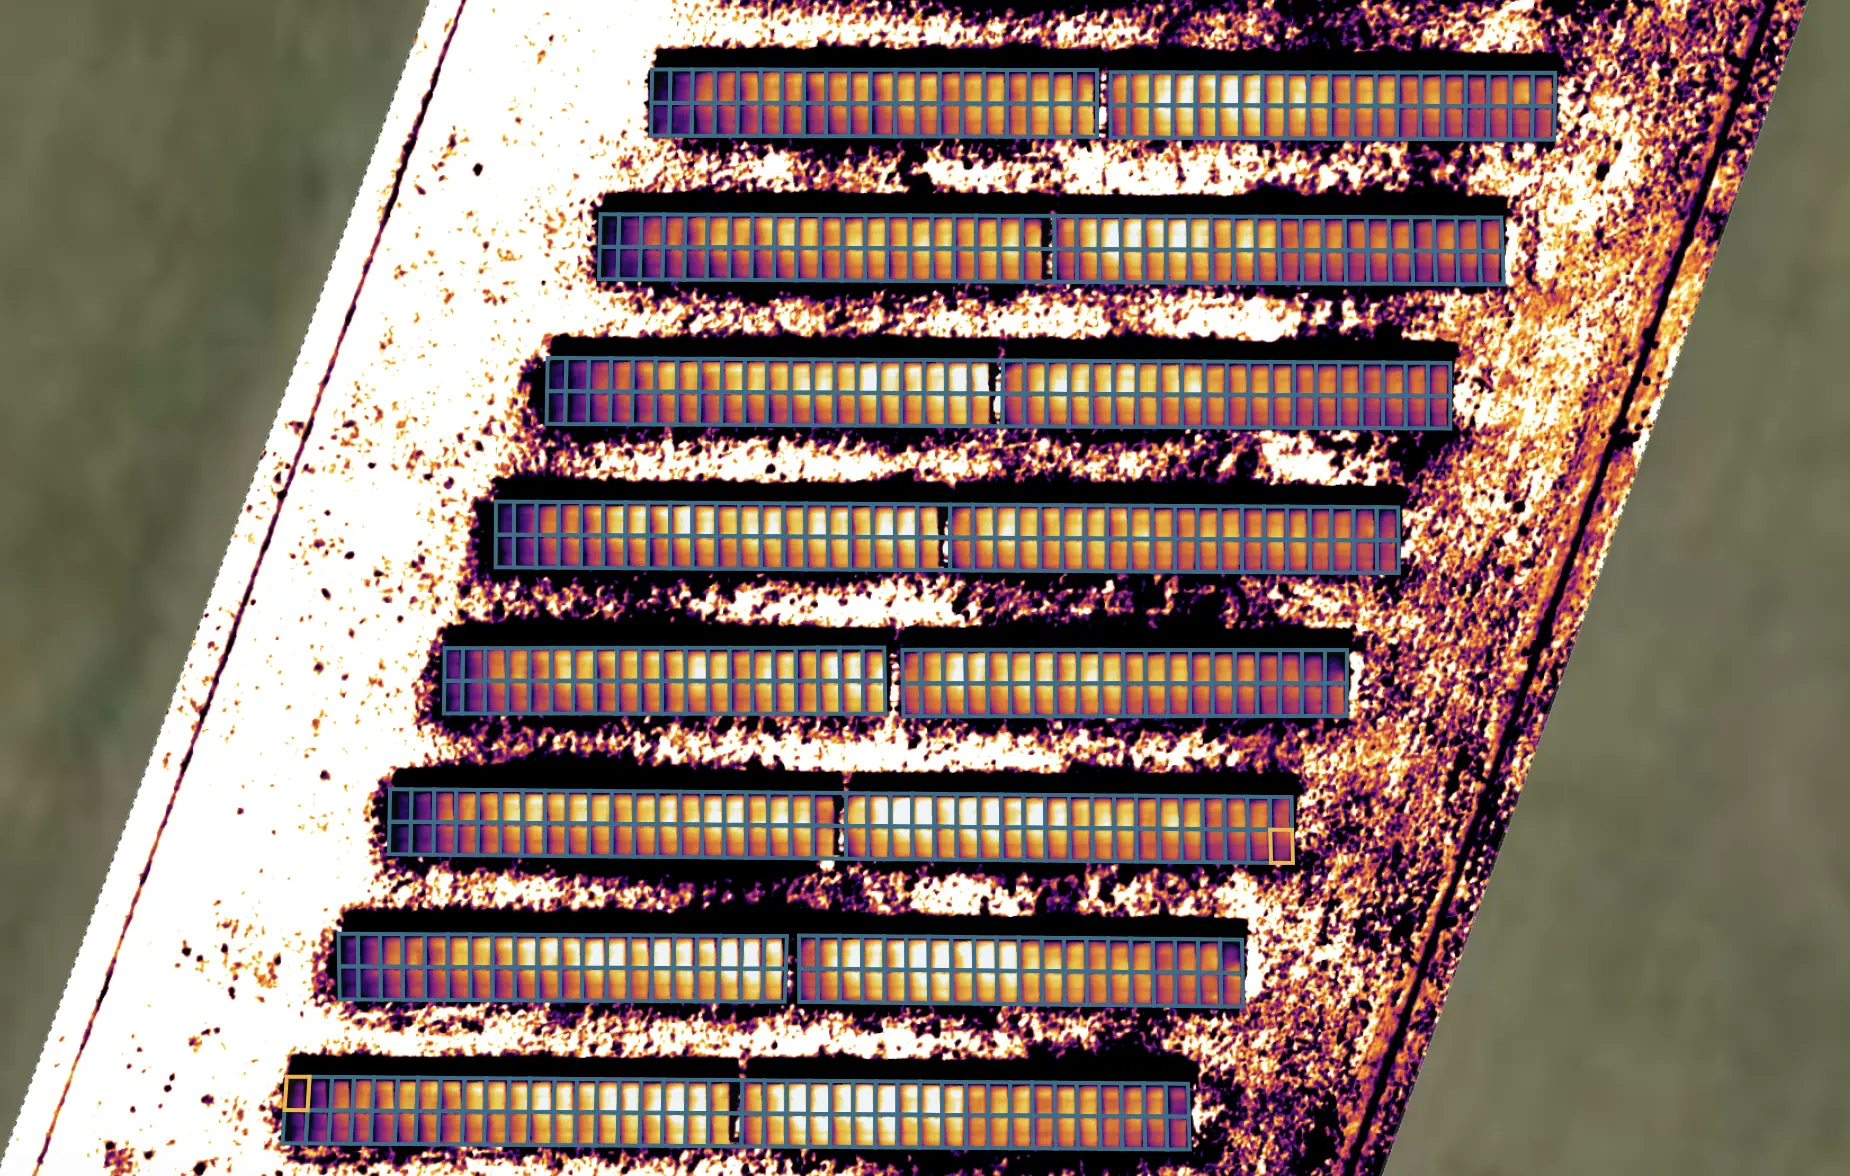
After a successful run, MapperTool automatically adjusts the thermal colour scale to a panel-based range. This makes temperature differences and possible hotspots on the panels easier to see than a scale calculated from the whole site.
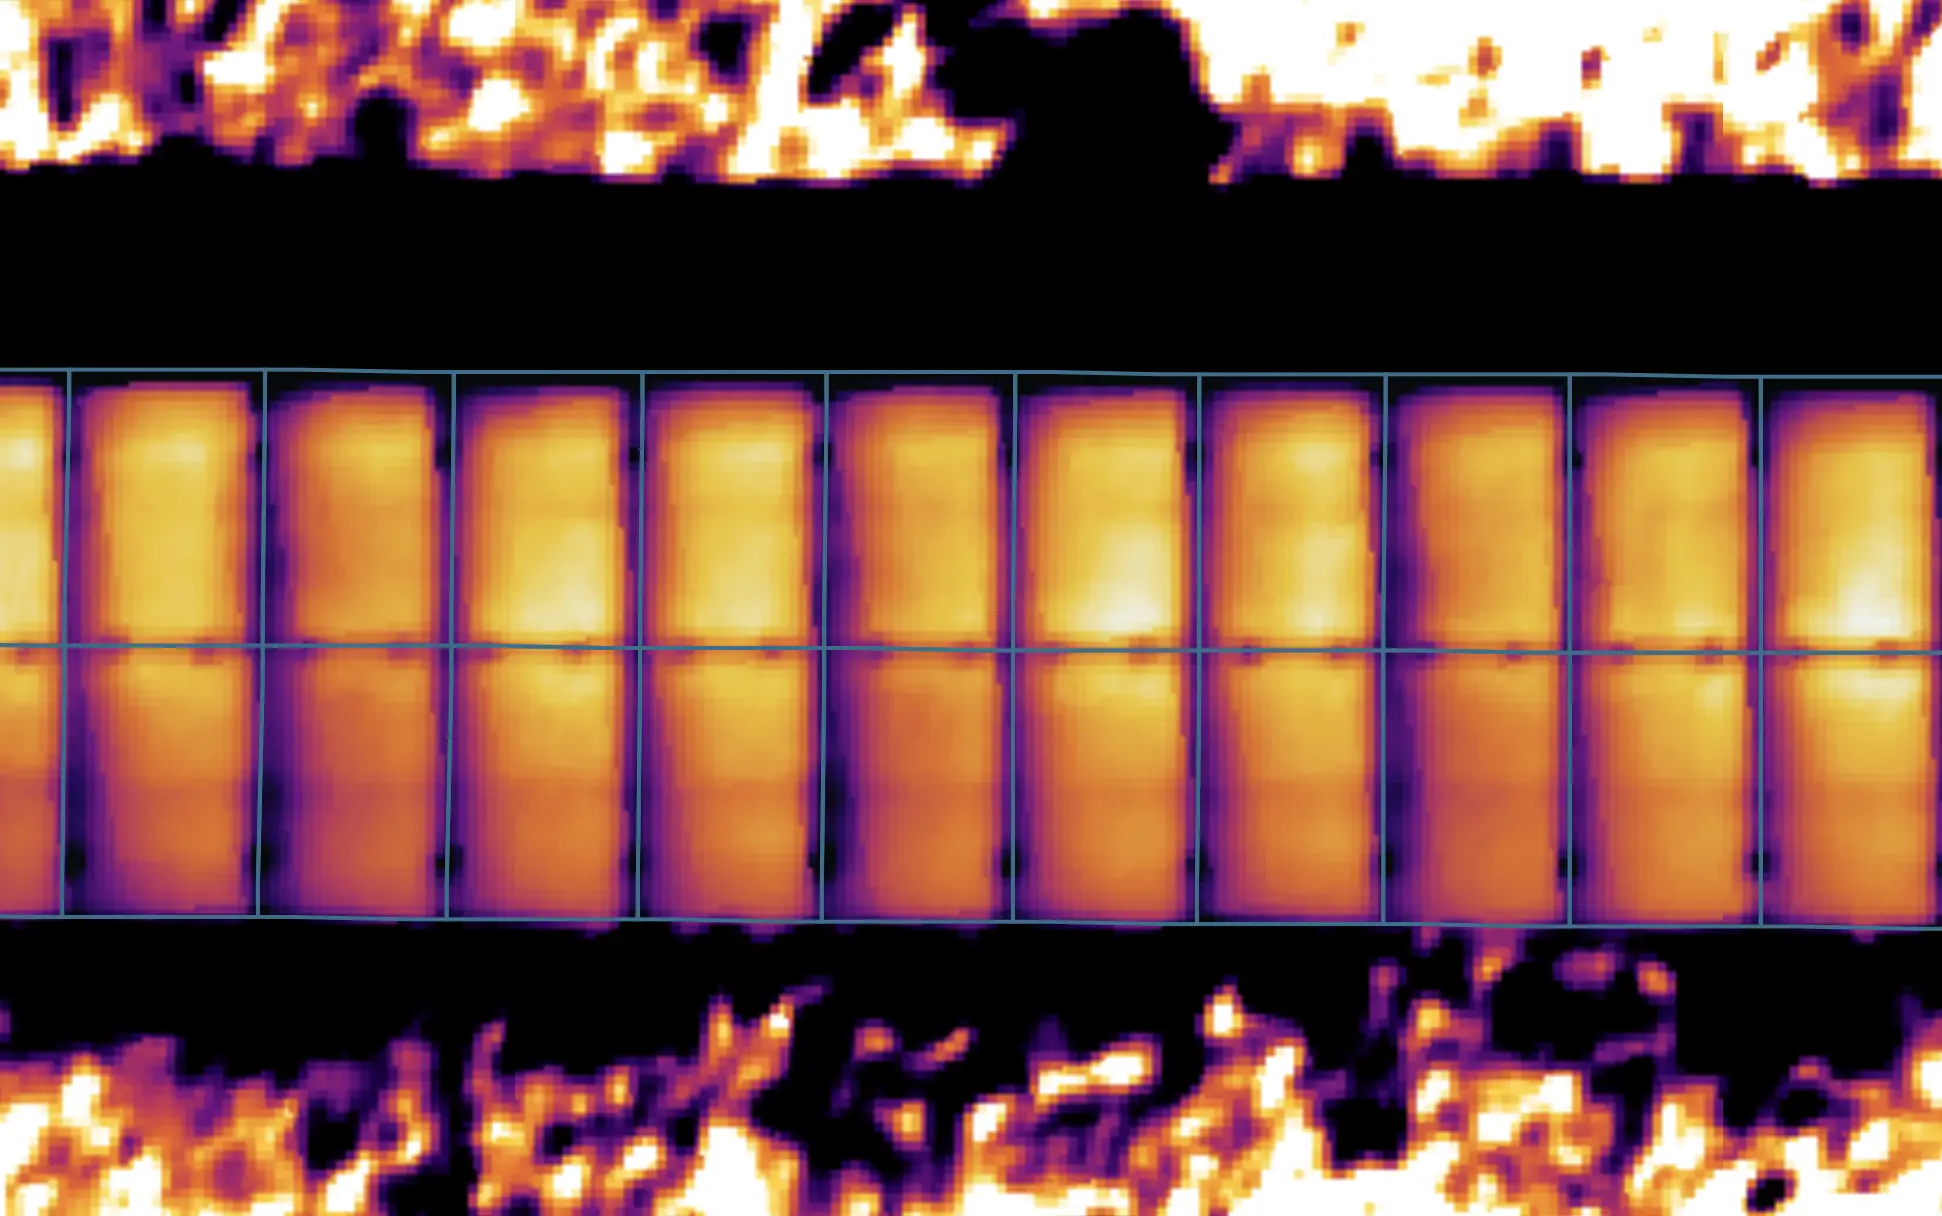
If the module cannot calculate a reliable panel-based range, the existing thermal map scale stays in place.
Inspecting one panel
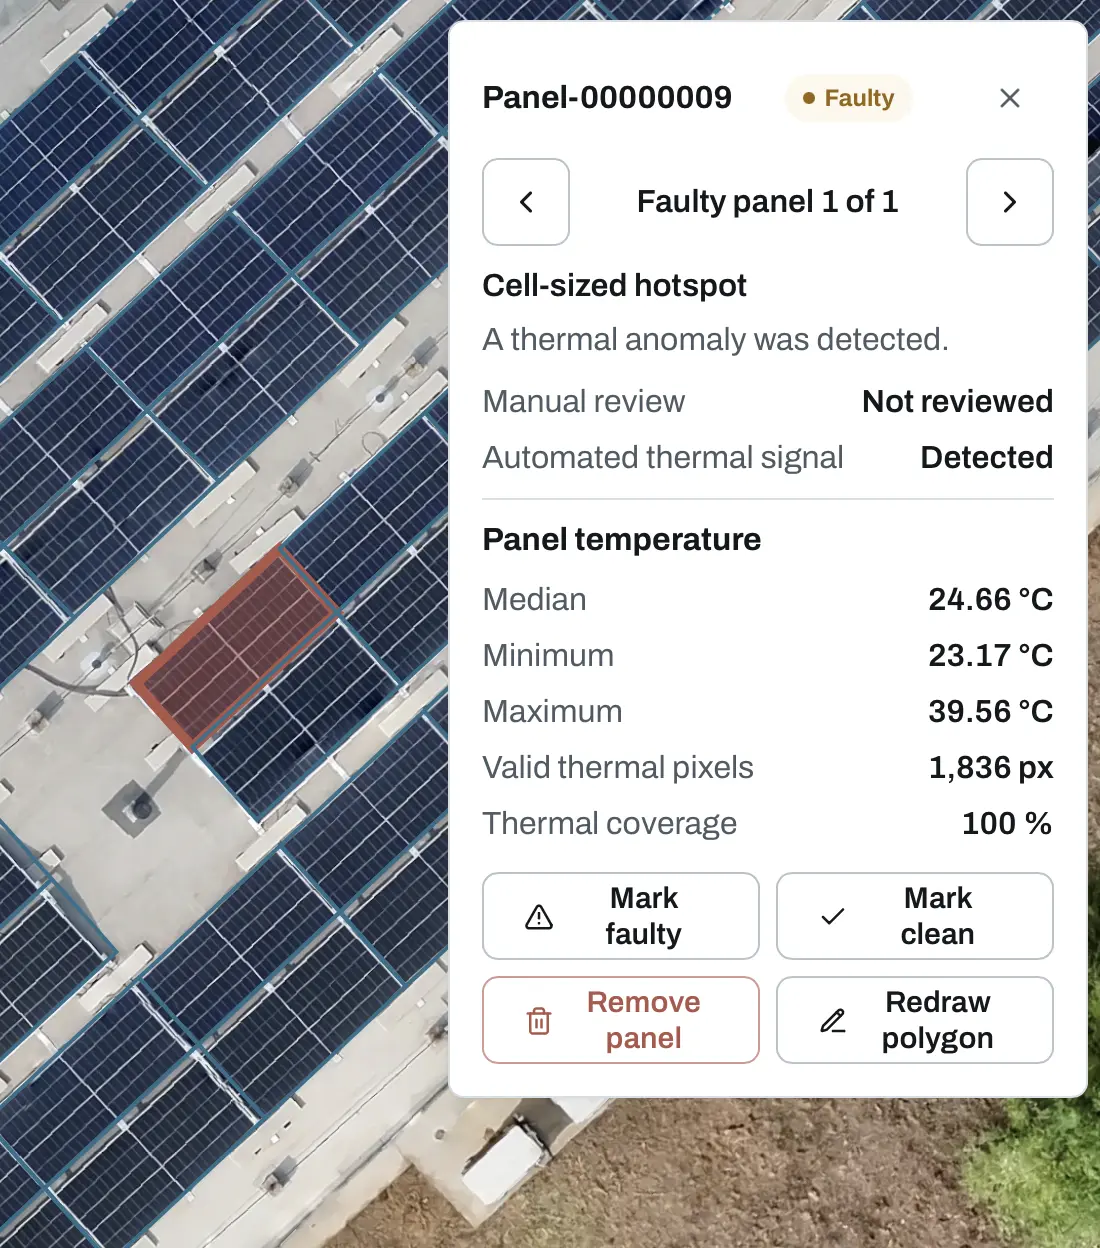
Click any detected polygon to open its panel record. The details include the panel ID and coordinates, the automatic and manual decisions, the detected thermal signal, and the panel temperature available for that polygon.
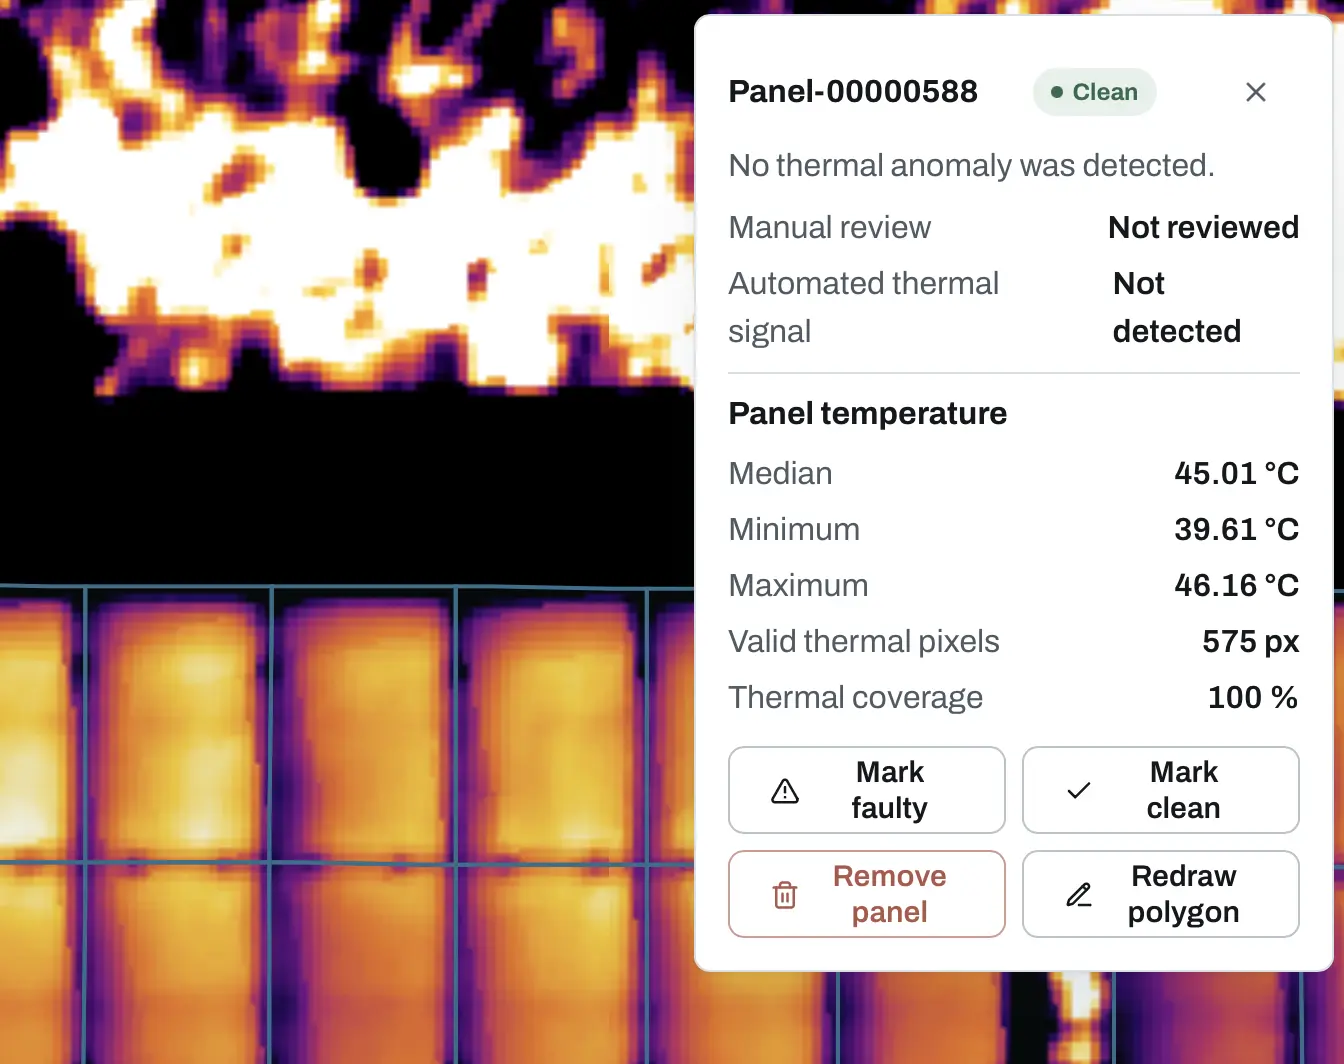
For each evaluated panel you can review:
- Panel temperature for the selected polygon.
- Valid thermal pixels used for the calculation.
- Thermal coverage, showing how much of the panel has usable temperature data.
- Automated thermal signal and the reason for the classification.
- Manual review state, kept separately from the automatic decision.
Reviewing a flagged panel
A faulty panel is highlighted on both source layers. Looking at the RGB and thermal views together helps separate a visible obstruction or geometry issue from a local thermal hotspot.
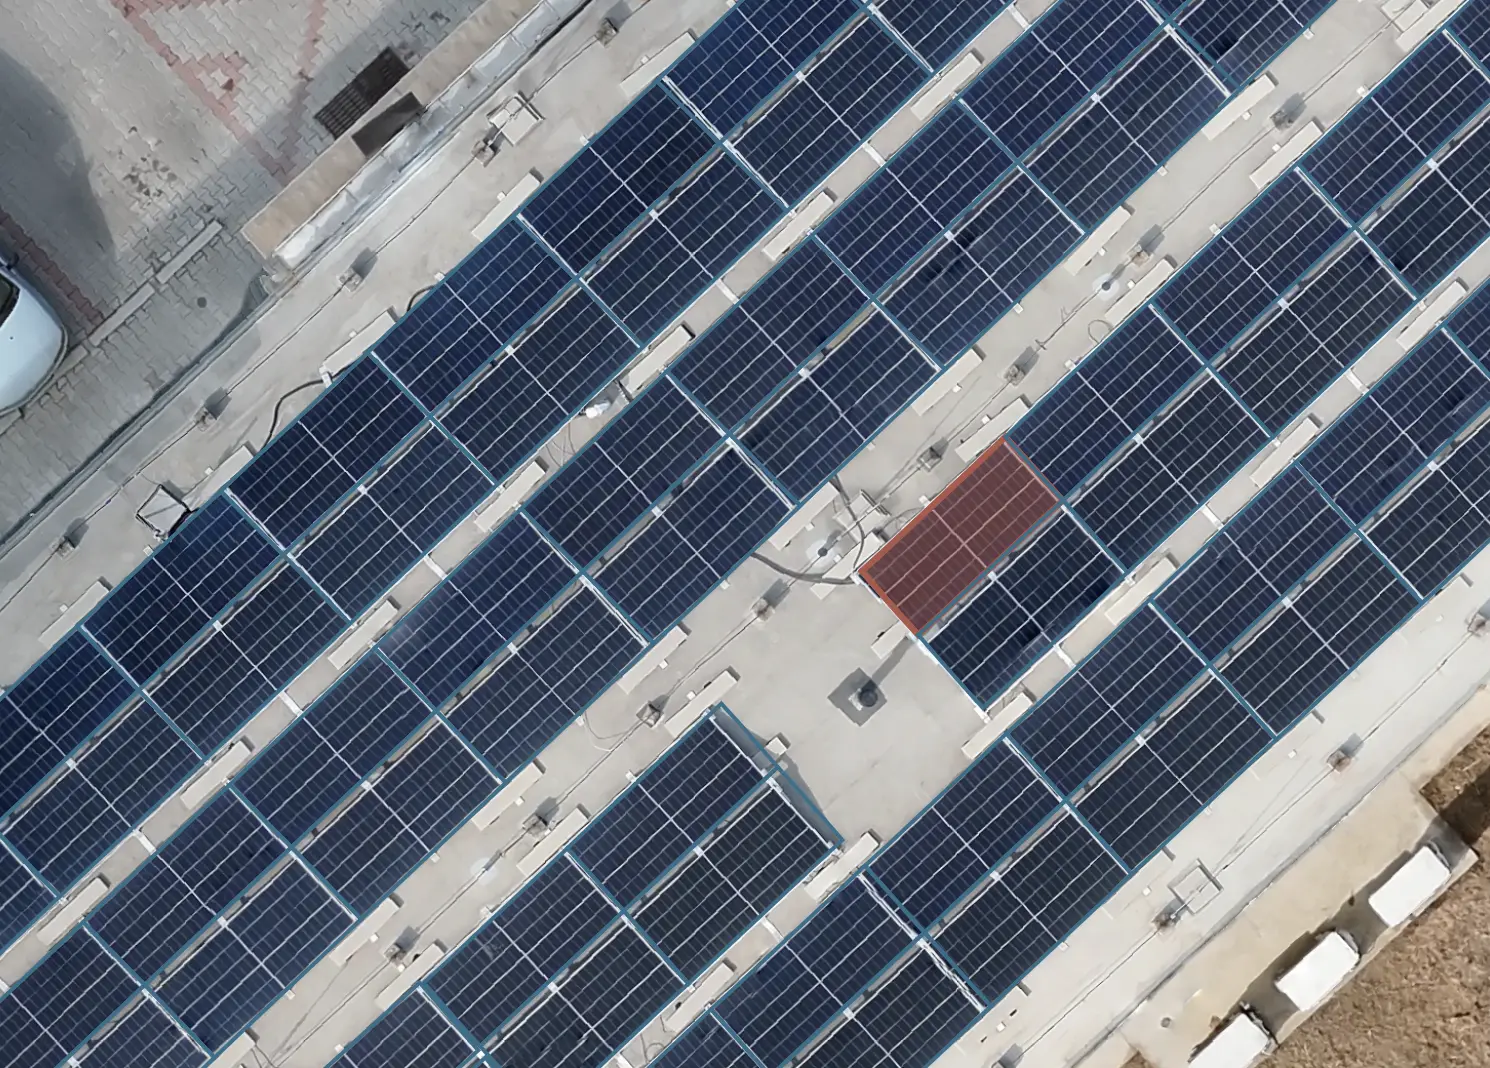
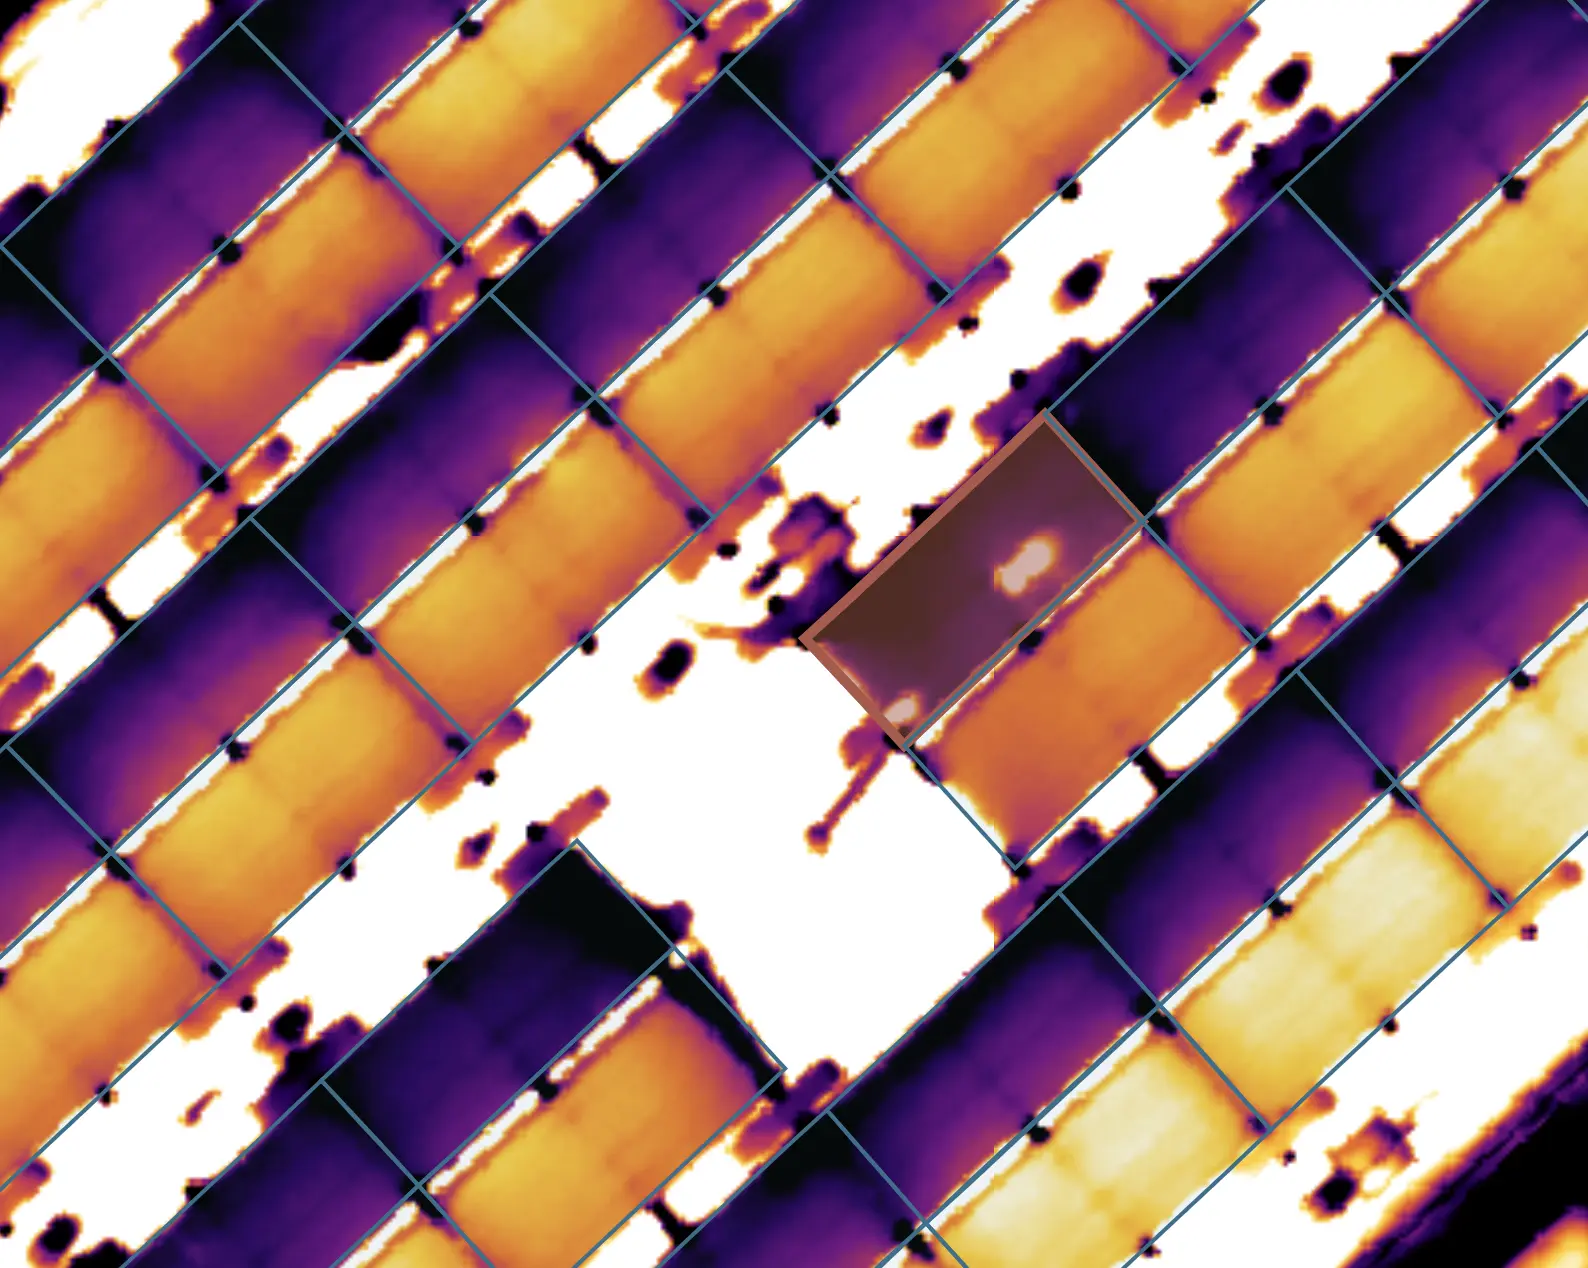
The panel record explains the detected pattern, for example a cell-sized hotspot, and shows the measurements behind the automatic result.
Correcting the result manually
Automatic detection is the starting point. You can correct the panel inventory directly on either the RGB or thermal layer:
- Mark faulty or Mark clean to record your own decision.
- Remove panel when a polygon is not a photovoltaic panel.
- Redraw polygon to correct the boundary of a detected panel.
- Draw new panel to add one the automatic detection missed.
Saved manual decisions and geometries remain with the project after the page is reloaded. A newly drawn or reshaped panel stays Not evaluated until Solar Inspect runs again against its saved geometry.
A successful new Solar Inspect run replaces the previous automatic result and all saved manual panel changes, including classifications, added panels, redrawn polygons and removals. MapperTool asks for confirmation before it overwrites an existing result. If the new run fails, the previous published result and saved manual changes remain available.
Downloading the results
Download all results packages the detected panel polygons, faulty panel polygons, their RGB and thermal map geometries, and the run report. These files can be archived with the project or used in another GIS workflow.
Adding Solar Inspect to a PDF report
Once Solar Inspect has completed successfully, Solar Inspect appears under Module results in the project's PDF report options. You can include:
- Faulty panels only, the default for a concise inspection report.
- All panels for a complete panel inventory.
- No inventory when you only need the module summary and selected map images.
The report can include the RGB and thermal layer images with their panel overlays, the module summary, panel classifications and the details behind flagged results. See generating a PDF report.
If manual changes are saved but Solar Inspect has not been run again, the PDF report warns that edits are pending and uses the last published analysis.