Online GIS viewer
Every result a project produced opens in the browser. The viewer is an online GIS for your own survey data, so you can load layers, measure on them and share the result without installing desktop GIS software or hunting for plugins.
The viewer has two modes, switched at the top: 2D map and 3D point cloud. Underneath sit three tabs, Measurements, Outputs and Sharing, and the header carries the project's expiry countdown and the Share button.
What the viewer gives you
- Map layers. Switch between the orthomosaic, elevation models, NDVI and thermal, with basemap, opacity and crop controls.
- Measurements. Distance, area, volume, height, pin points, lasso clip and temperature readings.
- Point cloud viewer. Orbit, pan and zoom through the 3D reconstruction, with appearance settings you can tune.
Downloads
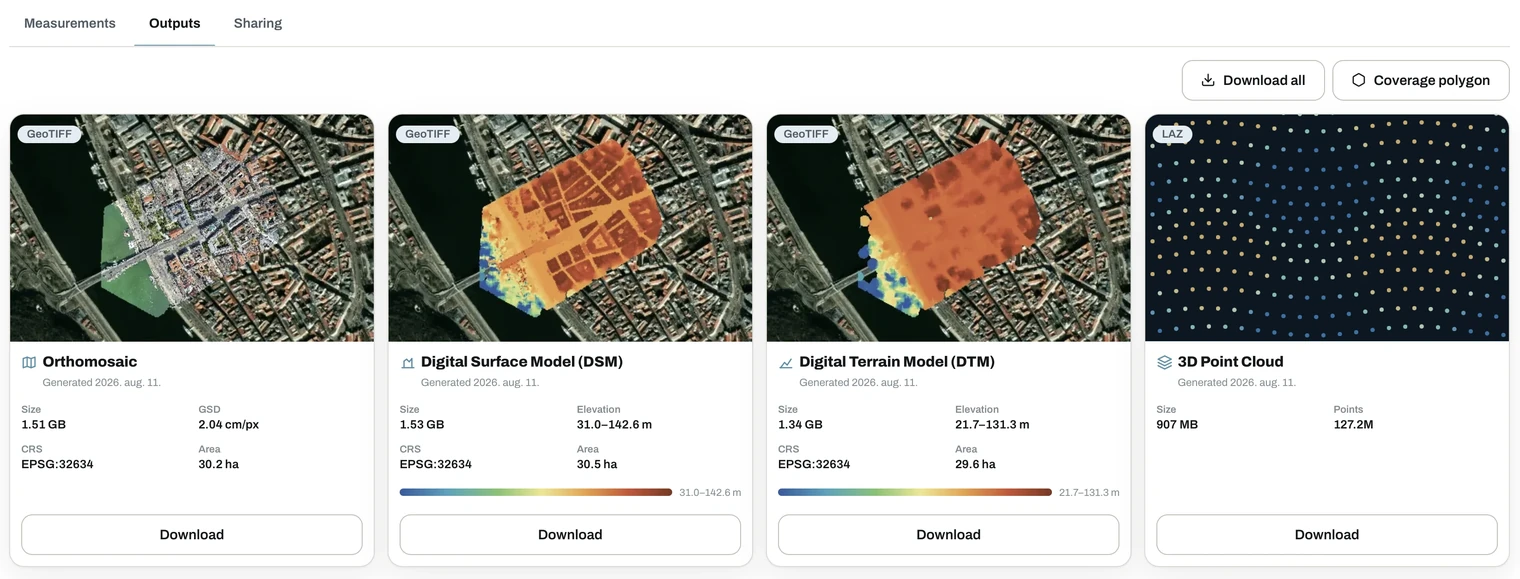
The Outputs tab lists everything the project produced, and tells you exactly what you are getting before you click download:
- The format badge,
GeoTIFForLAZ, and the generation date. - File size of each asset.
- GSD in cm per pixel for the orthomosaic.
- CRS, the coordinate reference system the raster is written in, for
example
EPSG:32634. - Covered area in hectares.
- Elevation range and its colour ramp for the DSM and DTM.
- Point count for the point cloud.
Two buttons sit above the list:
- Download all packages every output into one file.
- Coverage polygon exports the outline of the processed area.
In this section
06.01Map layersView your orthomosaic, DSM, DTM, NDVI and thermal results as layers on an interactive map, with a satellite or street basemap, opacity control and crop.06.02MeasurementsMeasure distance, area, volume and height on the map, drop pin points, clip layers with the lasso, read temperatures and measure in 3D.06.03Point cloud viewerExplore your 3D point cloud in the browser. Orbit, pan and zoom, colour by RGB, elevation or classification, and tune point size and lighting.