Thermal map
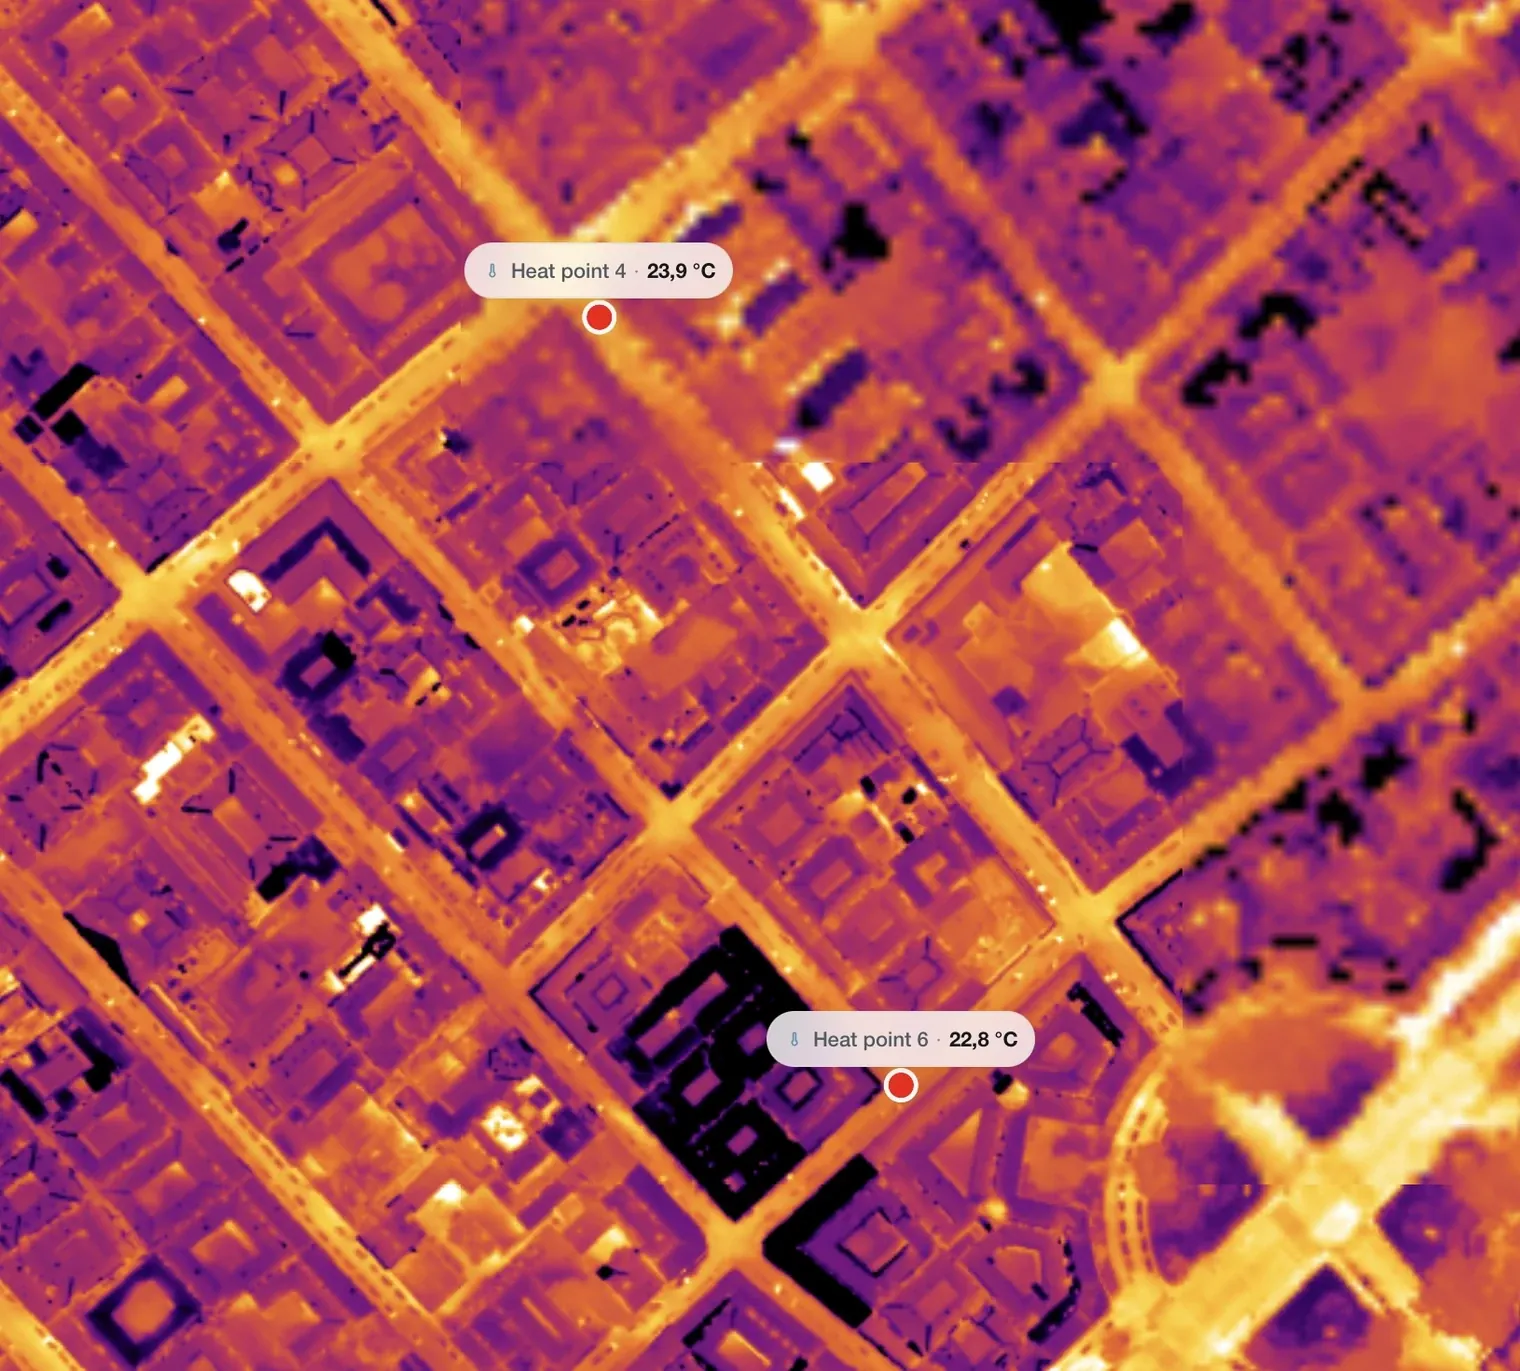
A thermal orthomosaic is a stitched, georeferenced temperature map of your site. Each pixel carries a measured surface temperature, so warm and cold spots can be located on the map instead of hunted through individual photos.
Download format: GeoTIFF, with temperature values stored per pixel.
Radiometric imagery is required
Radiometric means the camera stores a real temperature value for every pixel. Many thermal cameras only save a colourised preview image, which looks thermal but contains no temperature data.
A job with non-radiometric thermal images is rejected at the start, rather than producing a misleading map. Check your camera documentation.
Thermal output requires a Pro plan. See pricing.
Upload the RGB and the thermal images together in one project. The platform separates them by sensor, so you get both the orthomosaic and the thermal map from a single job.
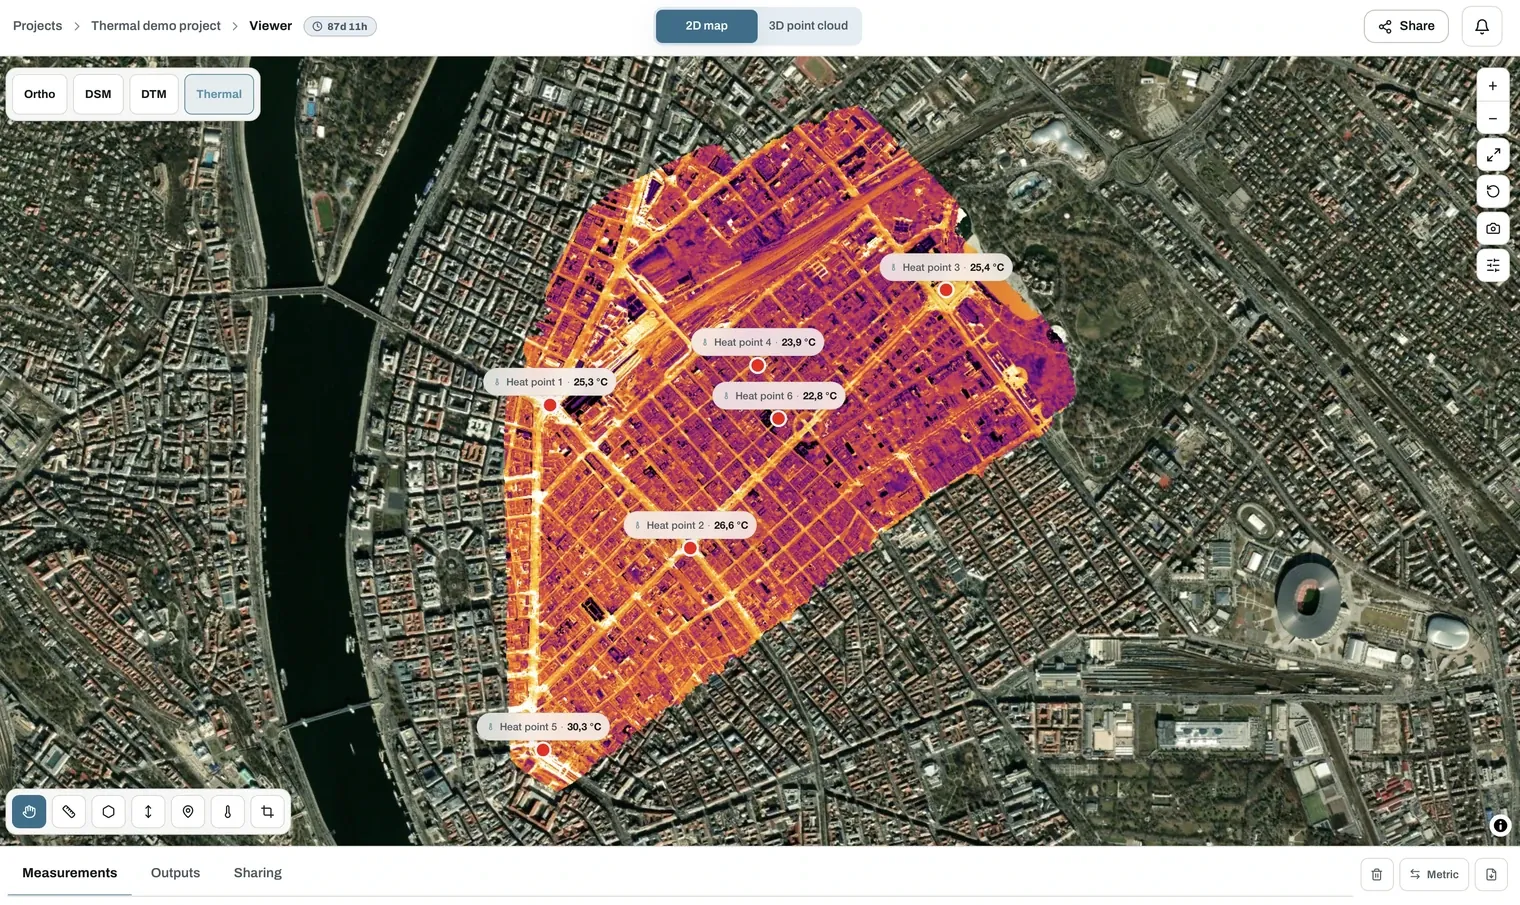
Reading the map
In the viewer the thermal layer is fully interactive.
Heat points
The heat point tool reads the surface temperature at any spot you click. Place as many as you need, name them, and compare the readings side by side in the measurement list.
Palette and scale
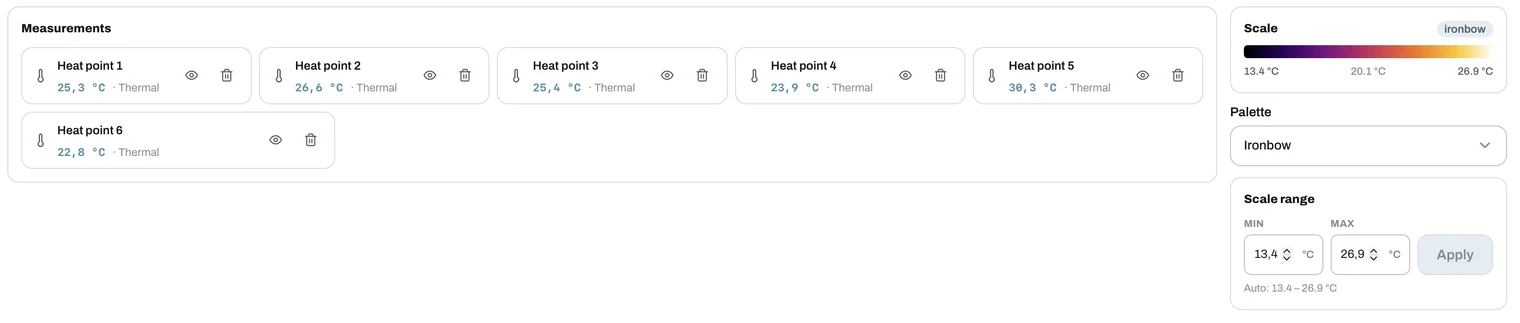
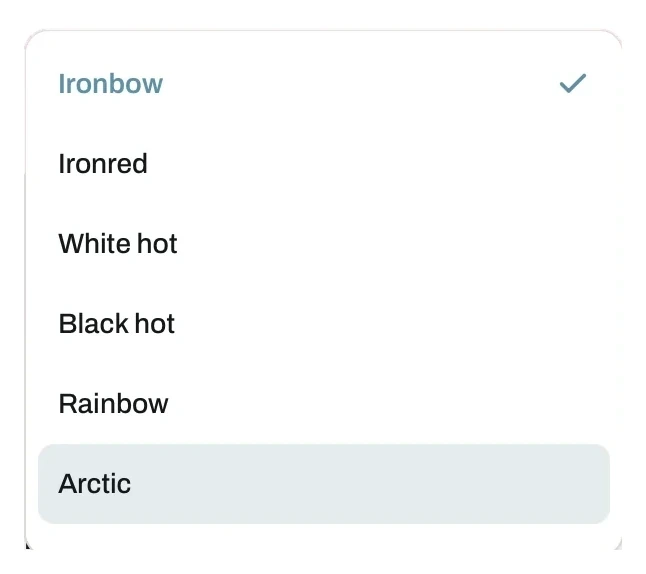
- Palette. A full set of thermal palettes to choose from, including Ironbow, Ironred, White hot, Black hot, Rainbow and Arctic. Pick whichever reads best for your subject.
- Scale range. The automatic range covers your data. Type your own minimum and maximum in °C and apply them to bring out small differences that a full-range scale flattens.
What it is used for
- Roof and building inspection. Heat loss, thermal bridges, trapped moisture and failing insulation across a whole roof in one pass.
- Solar farms. Faulty panels and strings appear as hot spots, located on a map.
- Infrastructure. Leaks in heating or water networks, overheating equipment.
- Environmental surveys. Surface temperature patterns across a field or water body.
Fly at dawn or after sunset. Thermal contrast is strongest when surfaces have released the heat absorbed during the day.