Measuring on the map
You can take real-world readings straight from a result, with no export step. Draw on the map and the value appears as a label you can keep.
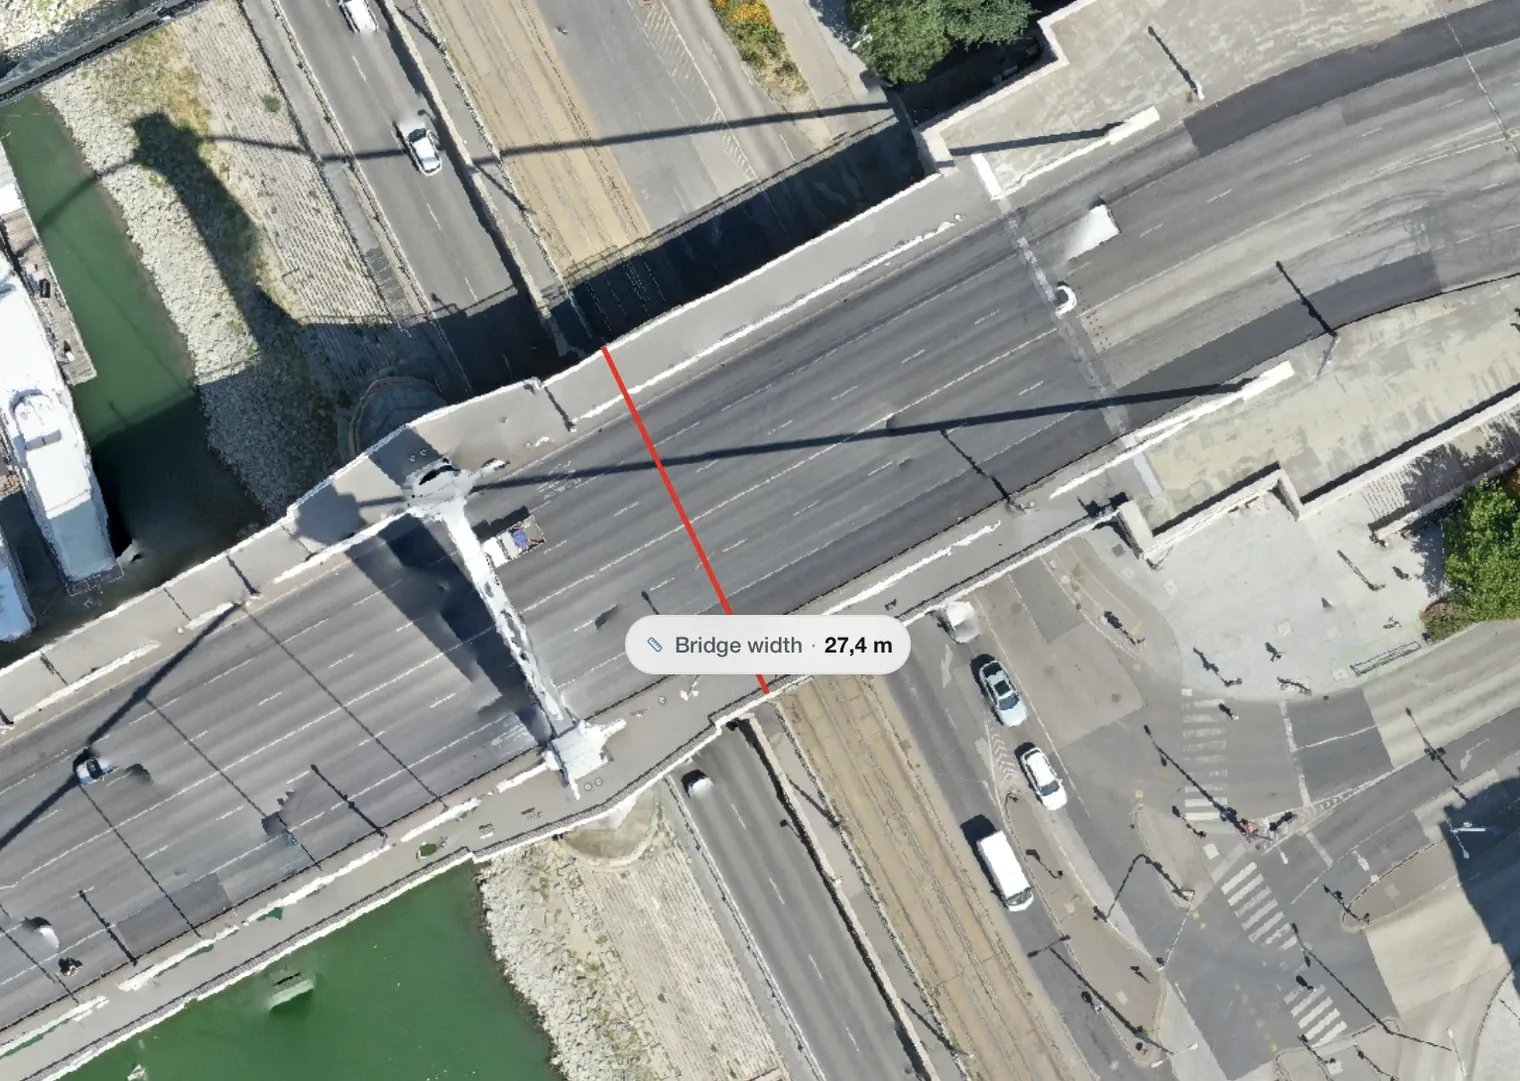
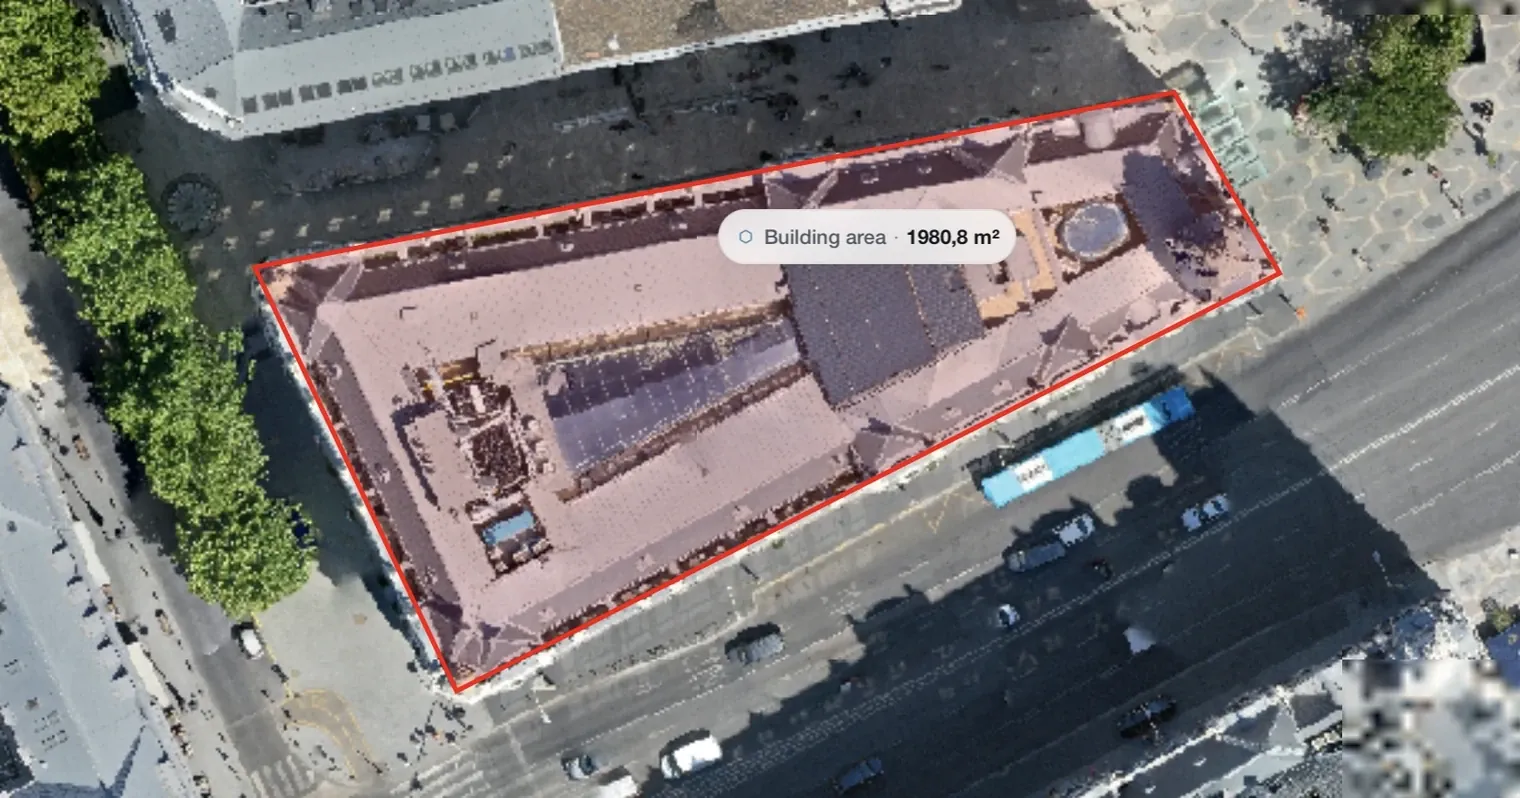
Measure an area on a map by outlining it, measure distance by drawing a line, and because the readings sit on a georeferenced result rather than on a screen image, every number is in real-world units.
The toolbar
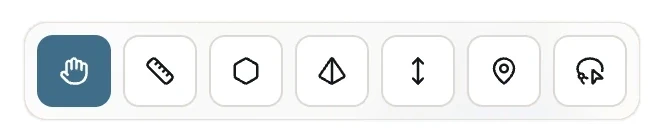
- Pan. Move the map without drawing. The default state.
- Distance. The length of a line or path. Site dimensions, setbacks, cable and fence runs.
- Area. The surface area of a polygon. Plot size, roof area, paved surfaces, treated zones.
- Volume. The volume above ground inside a polygon you draw. See below.
- Height. Elevation readings taken from the DSM or DTM.
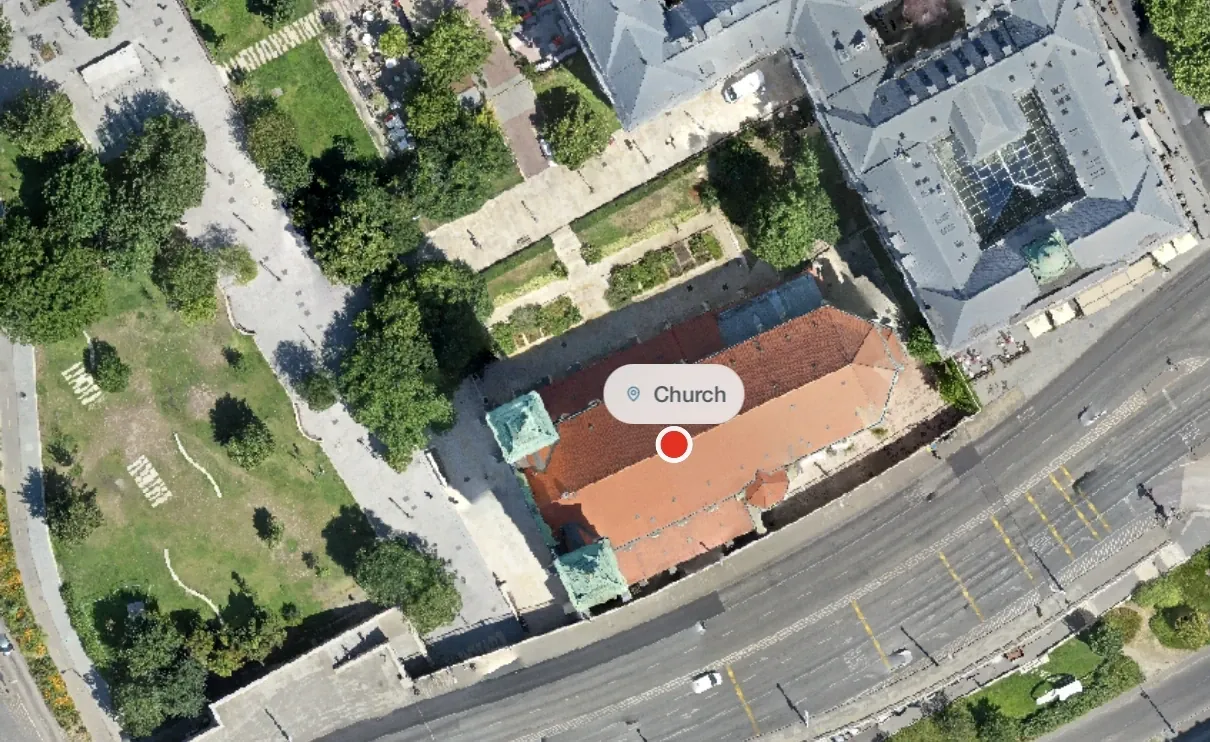
- Pin point. Mark and label a specific location, for example a defect, a sample site or a point of interest.
- Lasso clip. Cut a free-form shape out of the layers. See below.
Volume
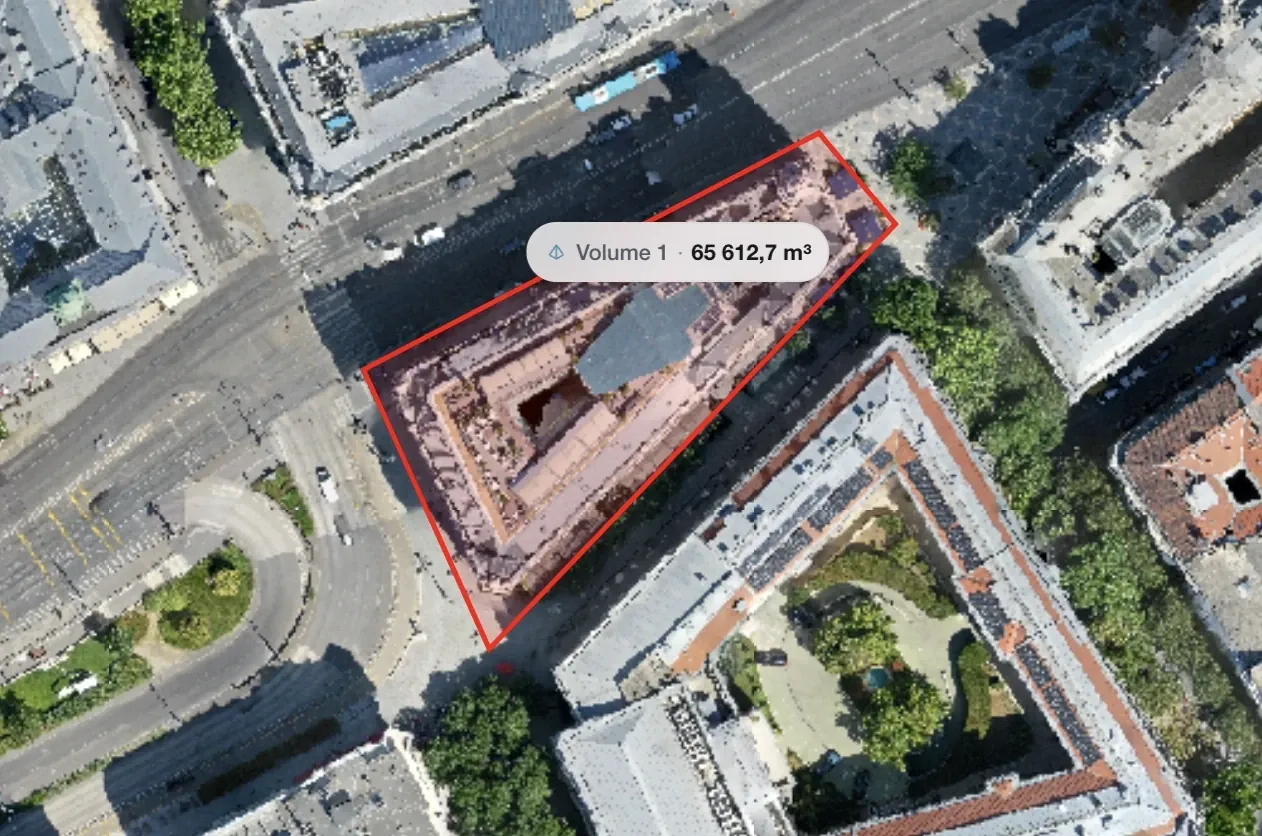
Outline an area with the polygon tool and MapperTool returns the volume above ground inside it, in cubic metres.
The figure is computed from the DSM, so it measures everything standing on the ground within your outline: a stockpile, an excavation, a building, a spoil heap.
- Stockpiles and earthworks. Aggregate, soil and waste volumes without a ground survey.
- Excavation progress. Repeat the same outline on a later flight and compare.
- Built volume. The mass of a building or structure above ground level.
A volume measurement needs the DSM, so select it when choosing outputs. Accuracy follows the elevation model, which depends on consistent altitude and good overlap in the flight. See flight basics.
Lasso clip
The clip tool is a free-form lasso, not a rectangle. Draw around the part of the site you care about and the layers are cut to that shape, so everything outside it disappears from the view.
- Useful for isolating one parcel, one building or one field from a large result.
- The clip applies to the layers on the map, not to the downloaded files.
- Press the X on the clip to undo it and bring the whole area back.
The measurement list

Everything you draw is saved with the project and listed in the Measurements tab.
- Rename a measurement so it means something to the next person who opens the project.
- Hide and show individual measurements without deleting them.
- Delete one, or clear them all.
- Export the set for use elsewhere.
- Metric / Imperial switches the units of every reading at once. Existing measurements re-display, so nothing has to be redrawn.
Measurements travel with a share link, so a client opens the project with your annotations already on it.
Temperature on thermal maps

On a thermal orthomosaic the toolbar gains an eighth tool, the heat point. Click anywhere to read the surface temperature at that spot, and drop several to compare hot and cold areas across a roof or a solar array.
Measuring in 3D
Distance, area and height are also available in the point cloud viewer. These measurements are taken in three dimensions, not projected onto a flat plane.
A slope measured in 3D is longer than the same slope measured on a 2D map, because the 3D measurement follows the actual surface. For roof surfaces, embankments and anything sloped, use the 3D view.
Before relying on a number, check a known distance on site against the map. If they disagree noticeably, the cause is usually in the flight.