NDVI vegetation map
NDVI, the Normalized Difference Vegetation Index, turns your imagery into a vegetation map. Healthy plants reflect near-infrared light strongly and absorb red light. NDVI compares the two bands and turns the ratio into a colour-coded index, so vigorous growth separates visually from stressed or bare ground.
For crop mapping this is the output that matters. An orthomosaic shows what a field looks like, an NDVI map shows how it is doing, field by field and row by row.
Download format: GeoTIFF, as a georeferenced index map.
Requirements
Your camera must record a near-infrared band. An RGB camera physically cannot capture what the index is computed from.
NDVI cannot be produced from ordinary photos, and the output requires a Pro plan. See image requirements and pricing.
Upload the RGB and the multispectral images together in one project. The platform separates them by sensor, so you get both the orthomosaic and the NDVI map from a single job.
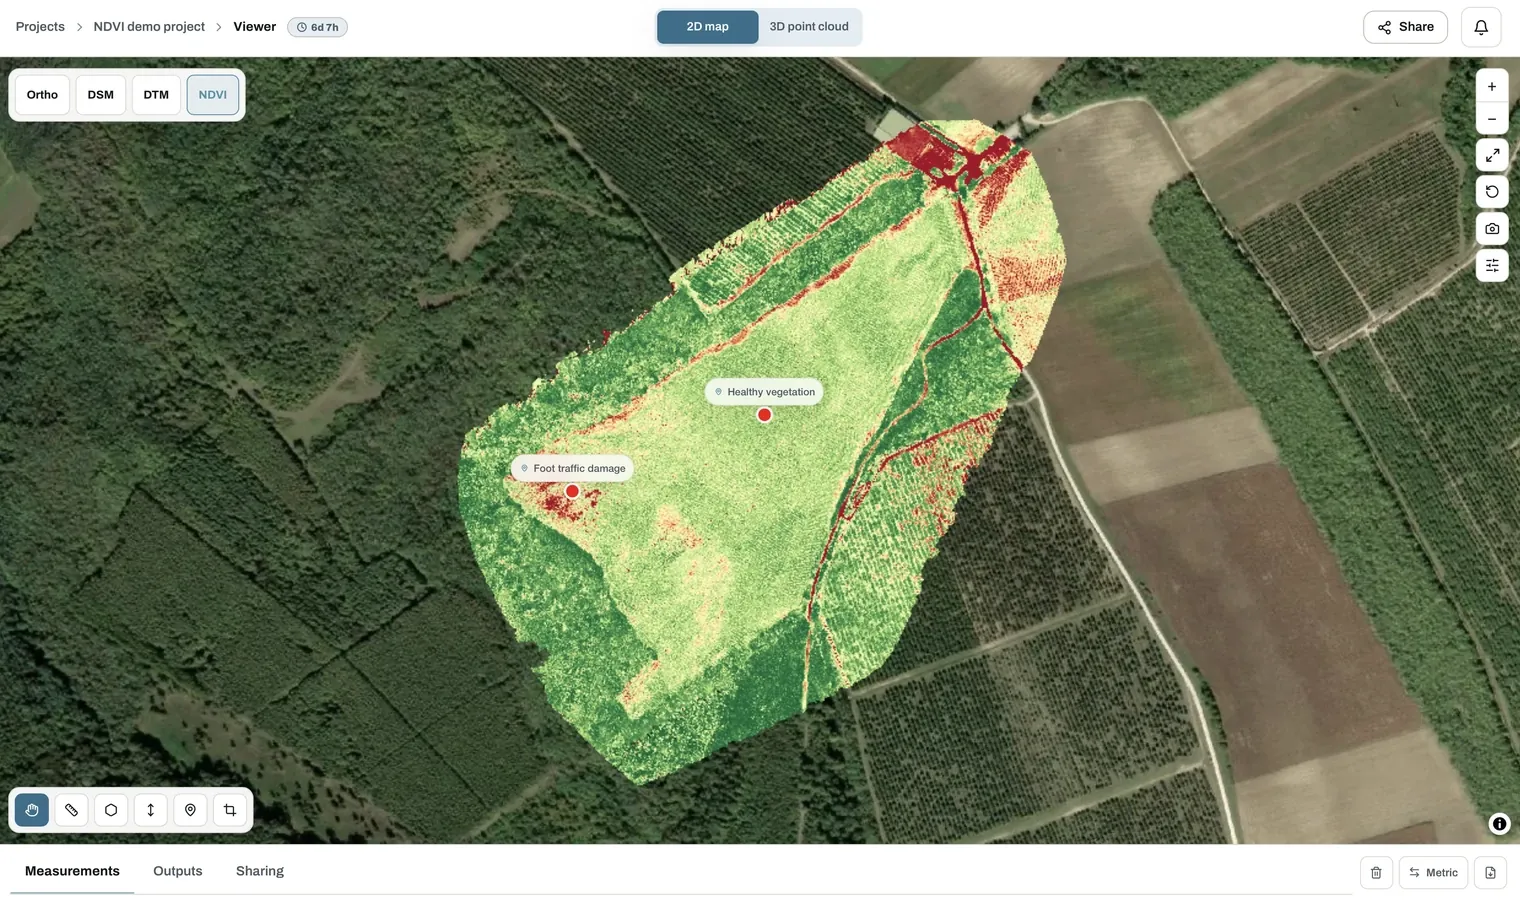
Reading the map
In the viewer the NDVI layer is interactive:
- Index scale. A colour ramp with the index range, by default the automatic minimum and maximum of your data.
- Scale range. Type your own minimum and maximum and apply them. Narrowing the range brings out differences that a full-range scale flattens.
- Pin points. Mark and name areas of interest, for example a stressed patch or a healthy reference zone, and keep them with the project.

What it is used for
- Early stress detection. Irrigation faults, nutrient deficiency and pest damage show up before they are visible to the eye.
- Zoning a field. Target fertiliser, sampling or replanting instead of treating everything uniformly.
- Monitoring over time. Repeat flights show whether a treated area is recovering.
- Damage documentation for insurance or subsidy claims, on a dated georeferenced map.
The layer opens in the viewer and can be shared with an agronomist or a client through a share link.